Simple Moving Average

The Simple Moving Average (SMA) is a technical indicator that calculates the average price of an asset over a specific number of periods. For example, a 20-day SMA adds up the closing prices of the last 20 days and divides by 20. As new prices come in, the average “moves” forward, smoothing out short-term fluctuations and highlighting the overall trend.
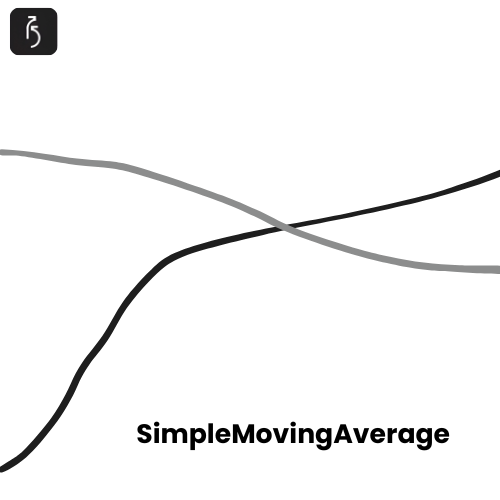
Systems you can build with an SMA

SMA is widely used in both beginner and advanced trading strategies. Here are a few common applications:

  • bearish signal happens when the short-term SMA crosses below the long-term SMA.

Trend Identification:

  • If the price is above the SMA, it may indicate an uptrend.
  • If the price is below the SMA, it may signal a downtrend.

Support and Resistance:

  • SMAs often act as dynamic support or resistance levels where price may bounce.

Crossover Strategies:

bullish signal occurs when a short-term SMA (e.g., 20-day) crosses above a long-term SMA (e.g., 50-day).