
Indicators
-
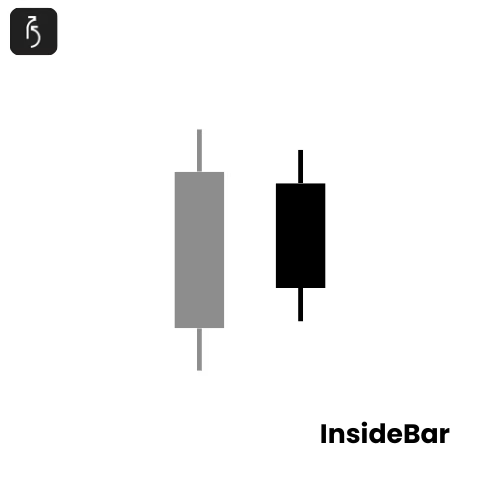
Imbalances

Imbalances in financial markets occur when buy and sell orders are uneven, often leading to price shifts. They signal excess demand or supply and can impact liquidity, volatility, and execution speed. Traders monitor imbalances to anticipate short-term market movements.
-
Weighted Moving Average
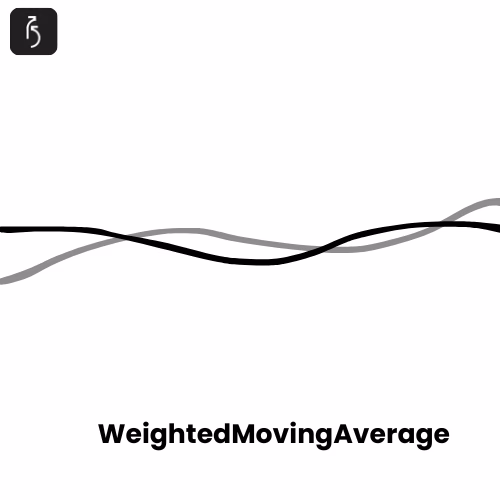
The weighted moving average (WMA) is a type of moving average that assigns greater importance to more recent data points. Unlike the simple moving average, which treats all values equally, WMA multiplies each data point by a predetermined weight before averaging.
-
Predictive Moving Average

Unlike simple or exponential moving averages, the Predictive Moving Average (PMA) uses a weighted moving average (WMA) to emphasize recent price data. It then applies a predictive logic to estimate future price direction, followed by a trigger line to confirm signals.
-
Simple Moving Average
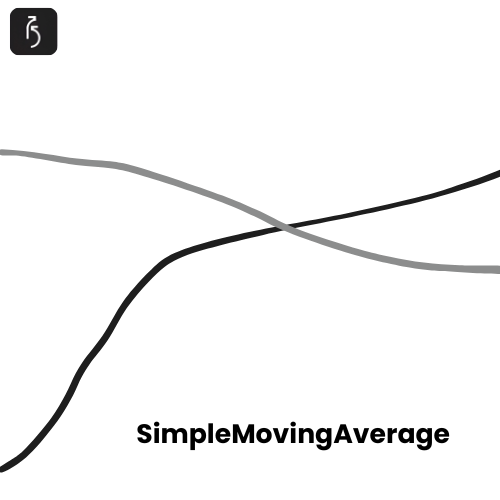
The Simple Moving Average (SMA) is a technical indicator that calculates the average price of an asset over a specific number of periods. For example, a 20-day SMA adds up the closing prices of the last 20 days and divides by 20. As new prices come in, the average “moves” forward, smoothing out short-term fluctuations and highlighting the overall trend.